Online learning has become more widespread and easier for businesses to manage. The Odoo 20 eLearning module provides an online learning platform where businesses can create courses, manage learning activities, and monitor attendees' progress. It also helps you manage reports, understand course activities, and follow attendee progress. You can see how learners are doing and what is happening within your courses. The Reporting section makes it easier to understand course performance and monitor learning activities. A course completion report also helps users understand how much of the learning content attendees have completed.
In this blog, we will explore how to access eLearning reports in Odoo 20 and use them to track attendee progress, course completion, and quiz results.
Accessing eLearning Reports
To access the reporting features, open the eLearning module from the Odoo 20 Community dashboard. The dashboard shows existing eLearning courses created, as shown below.
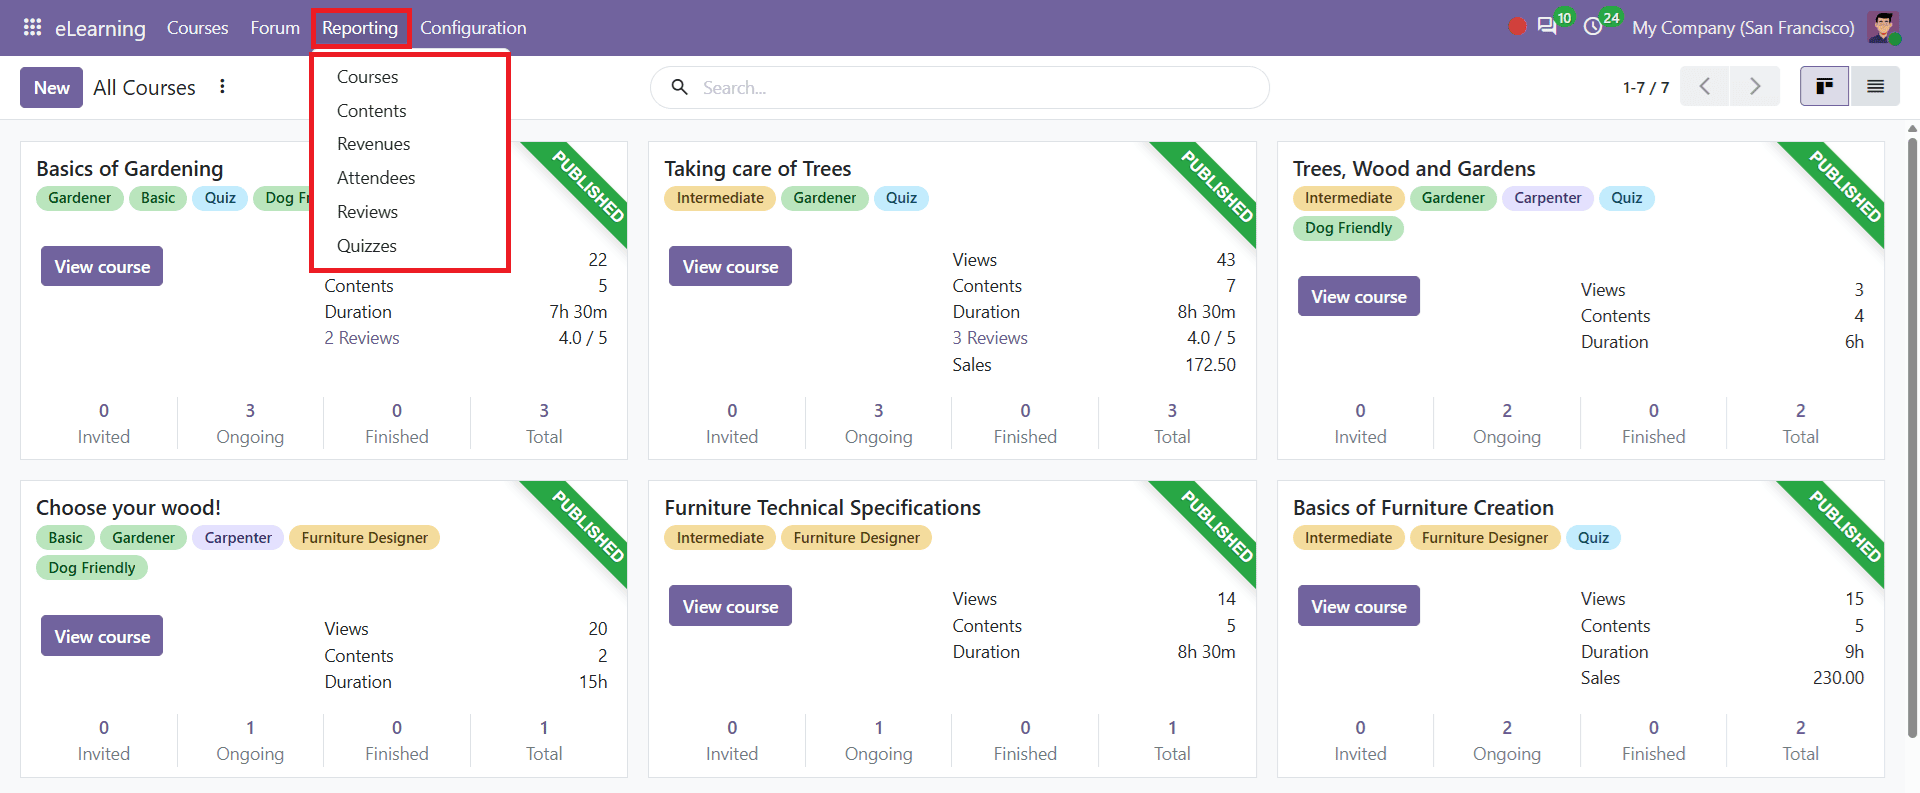
From the top menu, click Reporting to see available options. You will find six reporting options: Courses, Contents, Revenues, Attendees, Reviews, and Quizzes. These reporting options help users monitor learning activities and analyse course performance. They provide information about courses, attendees, reviews, and quiz results.
Courses
Select Courses from the Reporting menu. The course report displays a list of courses available in the eLearning module shown below.
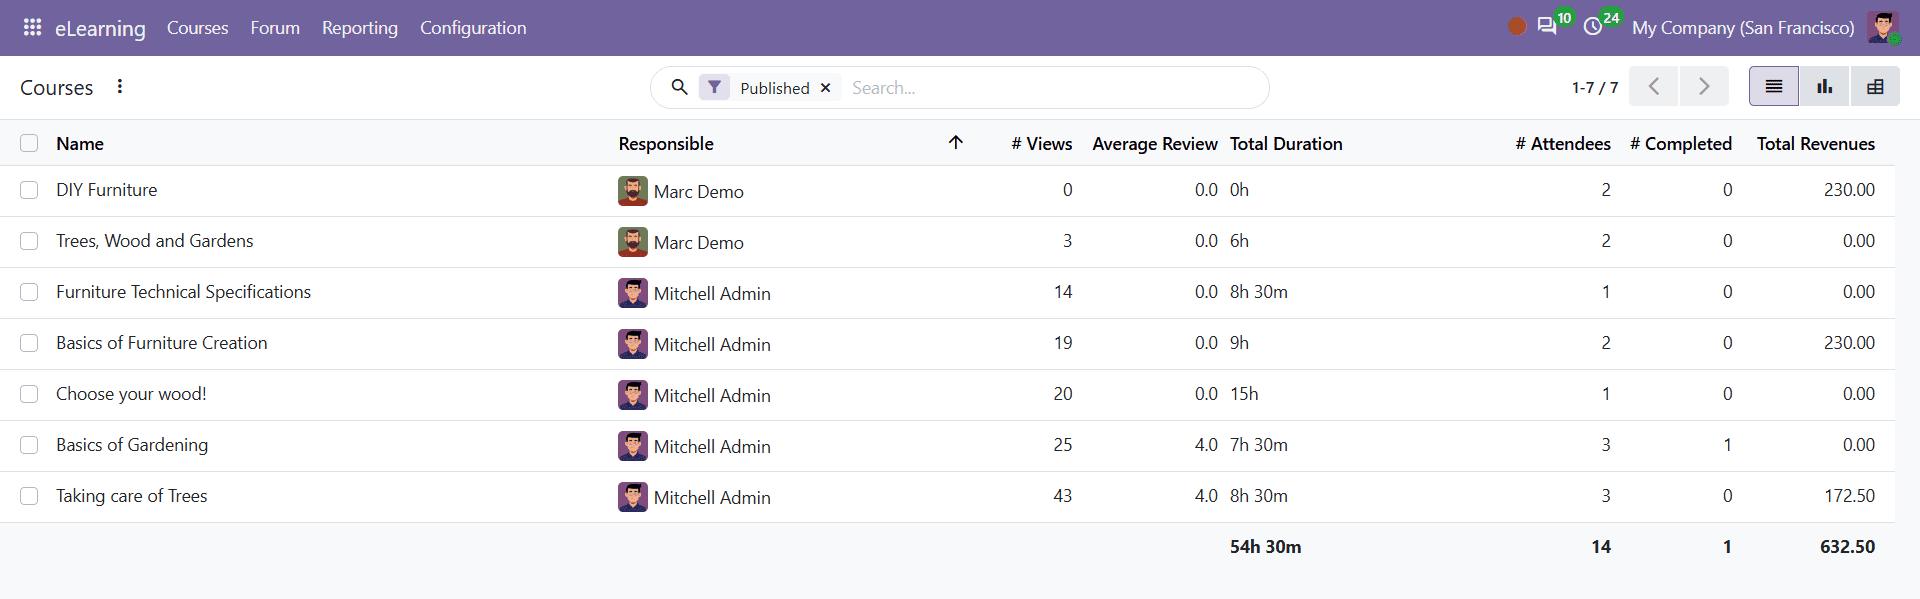
Each row represents a course, and the columns provide additional information about it. The count represents the number of users enrolled in a course. Odoo 20 uses the attendees count to keep track of enrolled attendees.
The report includes the number of views, average review, total duration, attendee count, number of completed attendees, and total revenue. Additionally, the data can be visualised using Graph and Pivot views. The Graph view helps visualise and compare course-related information, whereas the Pivot view helps organise and analyse information in a tabular format.
This information explains the overall performance, popularity, and reach of your created courses. It helps you track how well individual courses are driving overall student enrollment.
Contents
Open Contents from the Reporting menu. The report opens in the default Graph view with Total Views selected. The graph helps users understand how often different course materials are viewed. Hover over a graph item to see its view information.
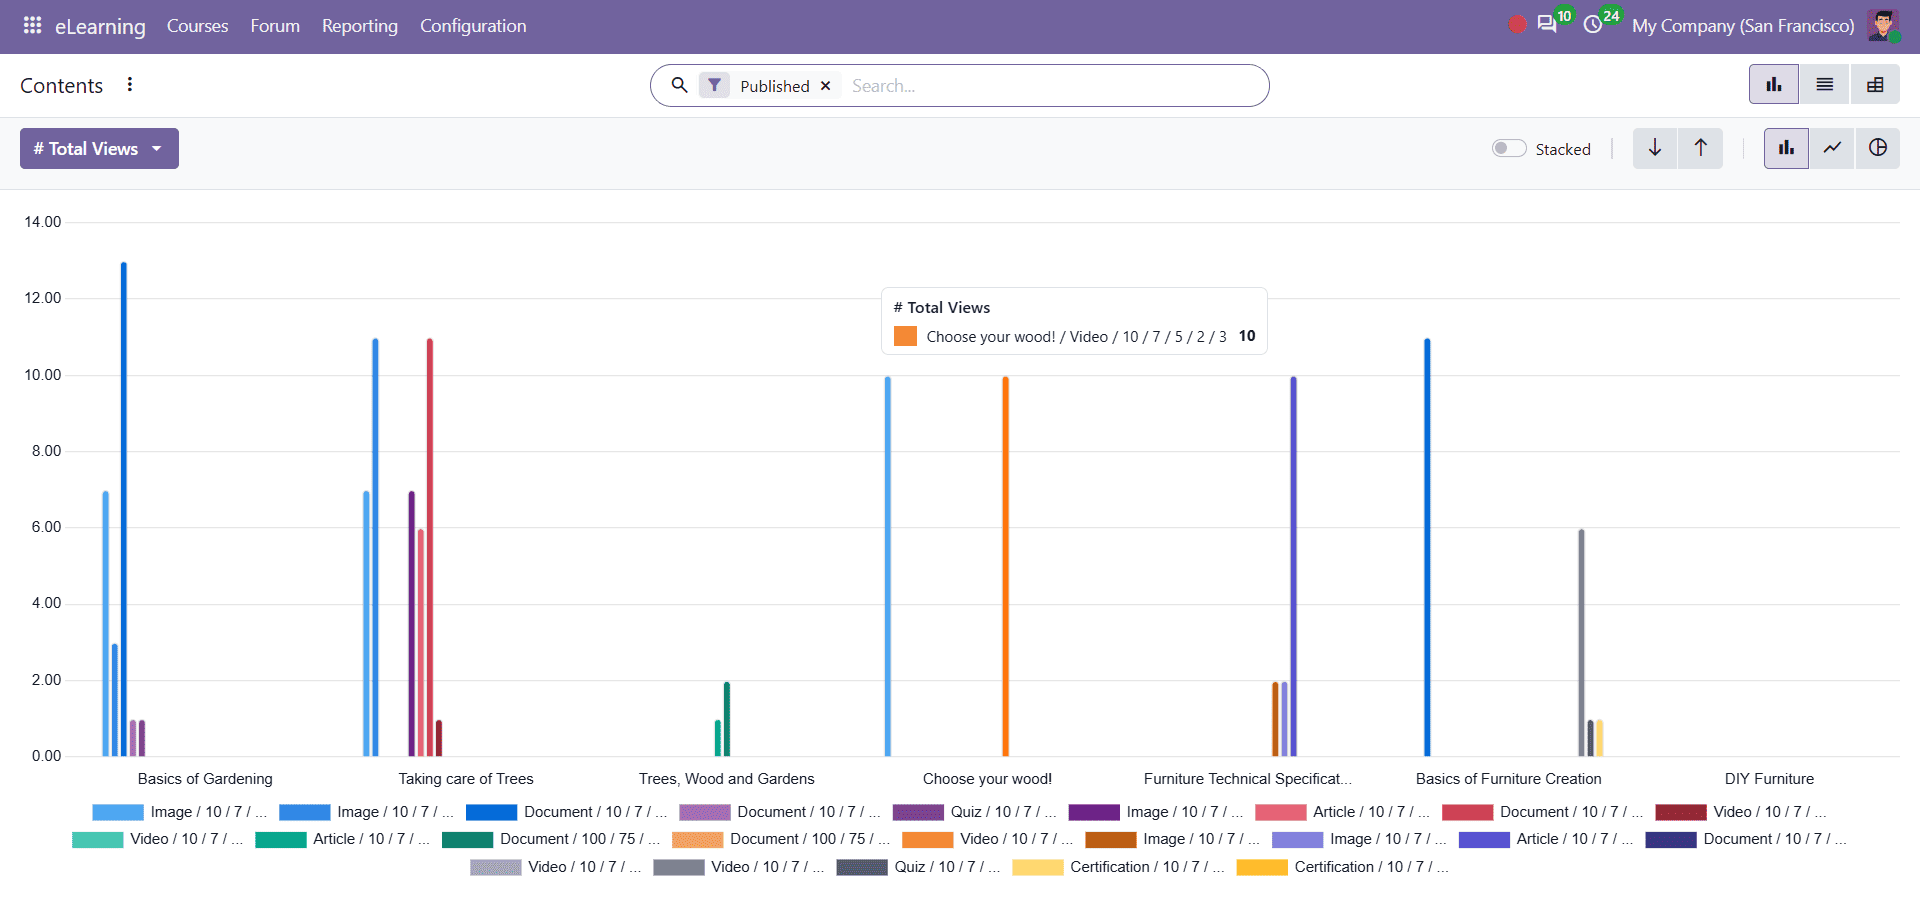
Different coloured bars represent the course content. The course and content labels are displayed below the graph. You can also change the graph type to a Line Chart or Pie Chart.
If you click on a content item in the graph, a new window opens, as shown below.
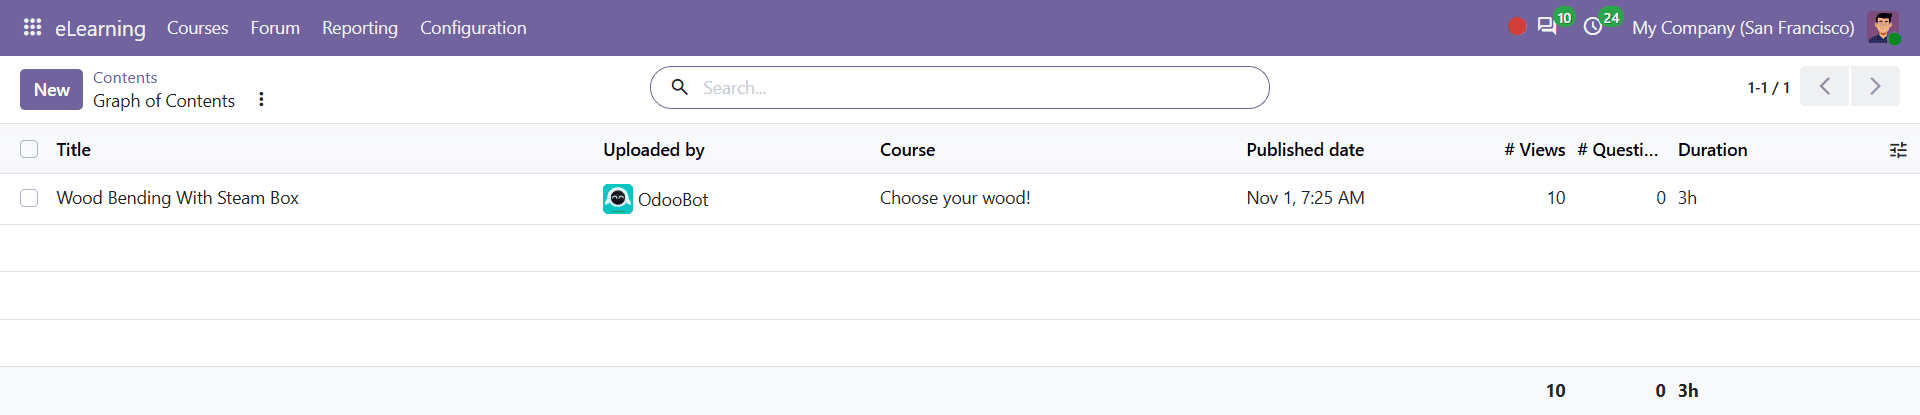
This section explains the performance of specific learning materials within your courses, such as Images, Documents, Videos, Quizzes, and Articles. It shows which specific pieces of content are heavily consumed, interacted with, or where students spend their time.
To select different measures, click Total Views, and you can see the available options as given below.
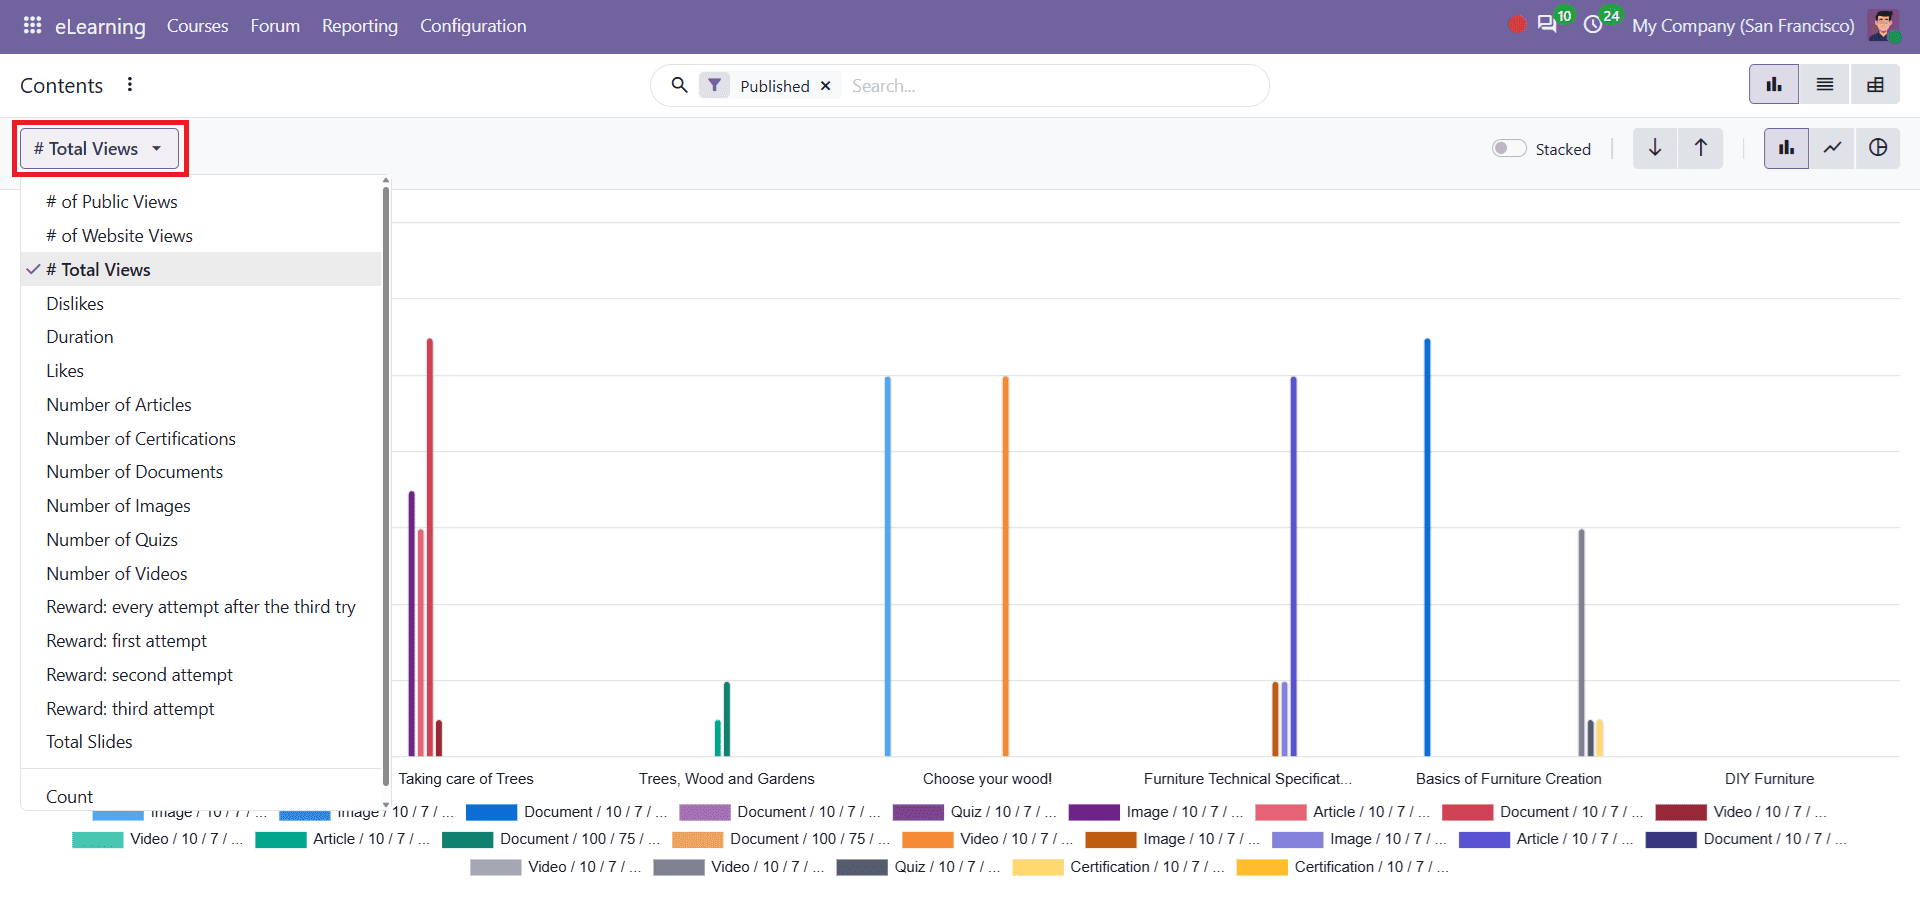
You can select a measure based on the information you want to analyse.
Revenues
Select Revenues from the Reporting menu to view the revenue generated through the eLearning platform. The report displays revenue information in a graphical format, with months shown along the horizontal axis and Total selected as the measure.
The revenue report displays the financial performance of your eLearning platform. The report is displayed in a Line Chart by default. You can also switch to a Bar Chart or a Pie Chart.
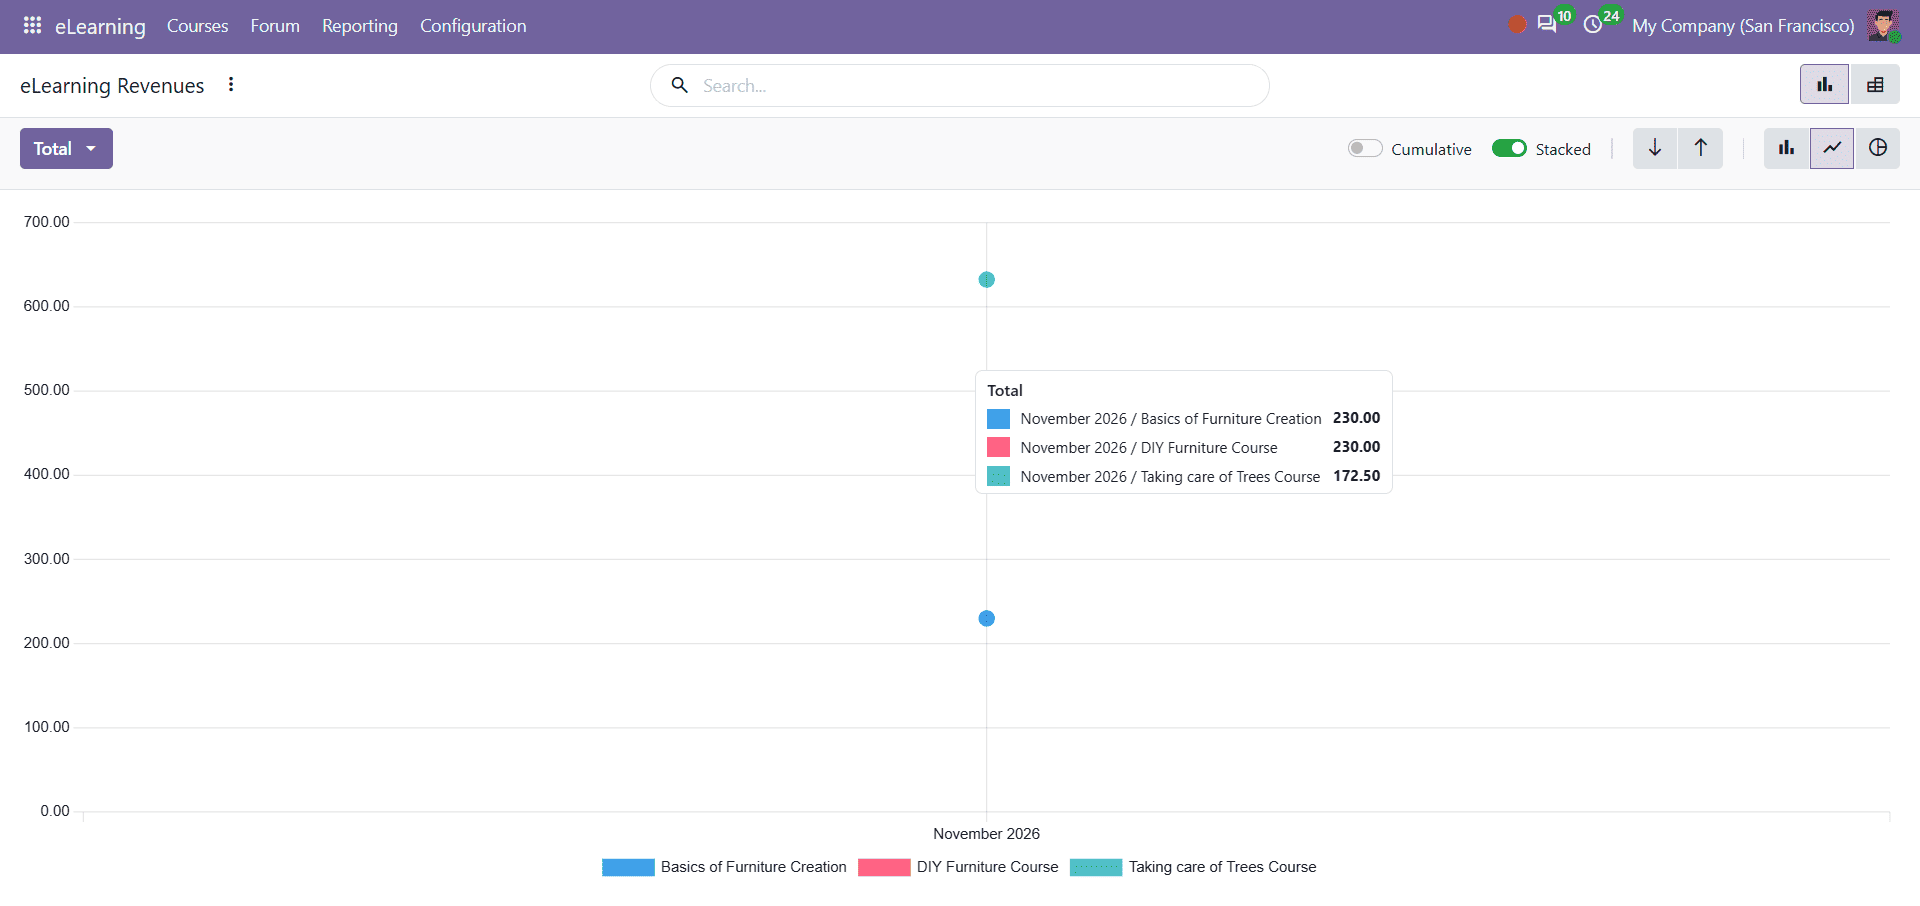
The different colours in the Line chart represent individual courses, making it easier to compare the revenue generated by each course over different months. This report helps businesses monitor course revenue and understand the financial performance of their eLearning platform.
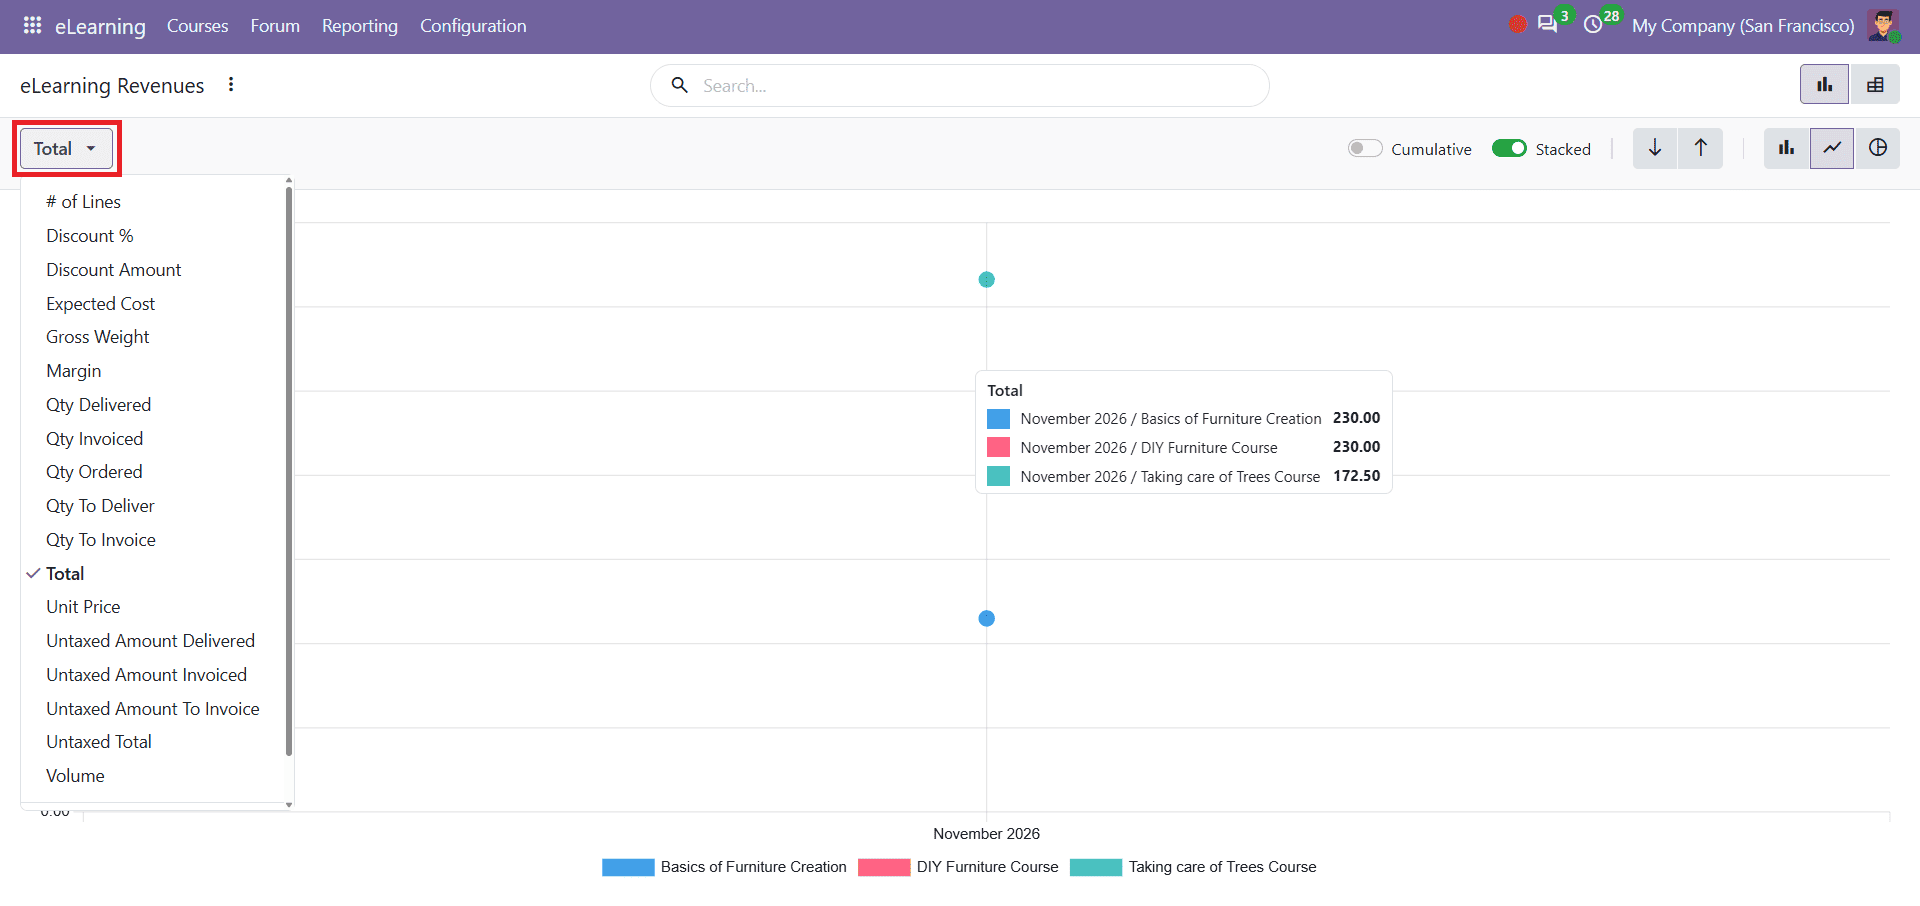
To change the view to different measures, click on the total, and you can see available options.
Attendees
Next, select Attendees from the Reporting menu. The default Bar Chart shows the number of attendees who have not started, are ongoing, or have finished the course. This helps users check the progress of learners enrolled in different courses. This allows course managers to understand how many learners have started, are currently taking, or have completed a course.
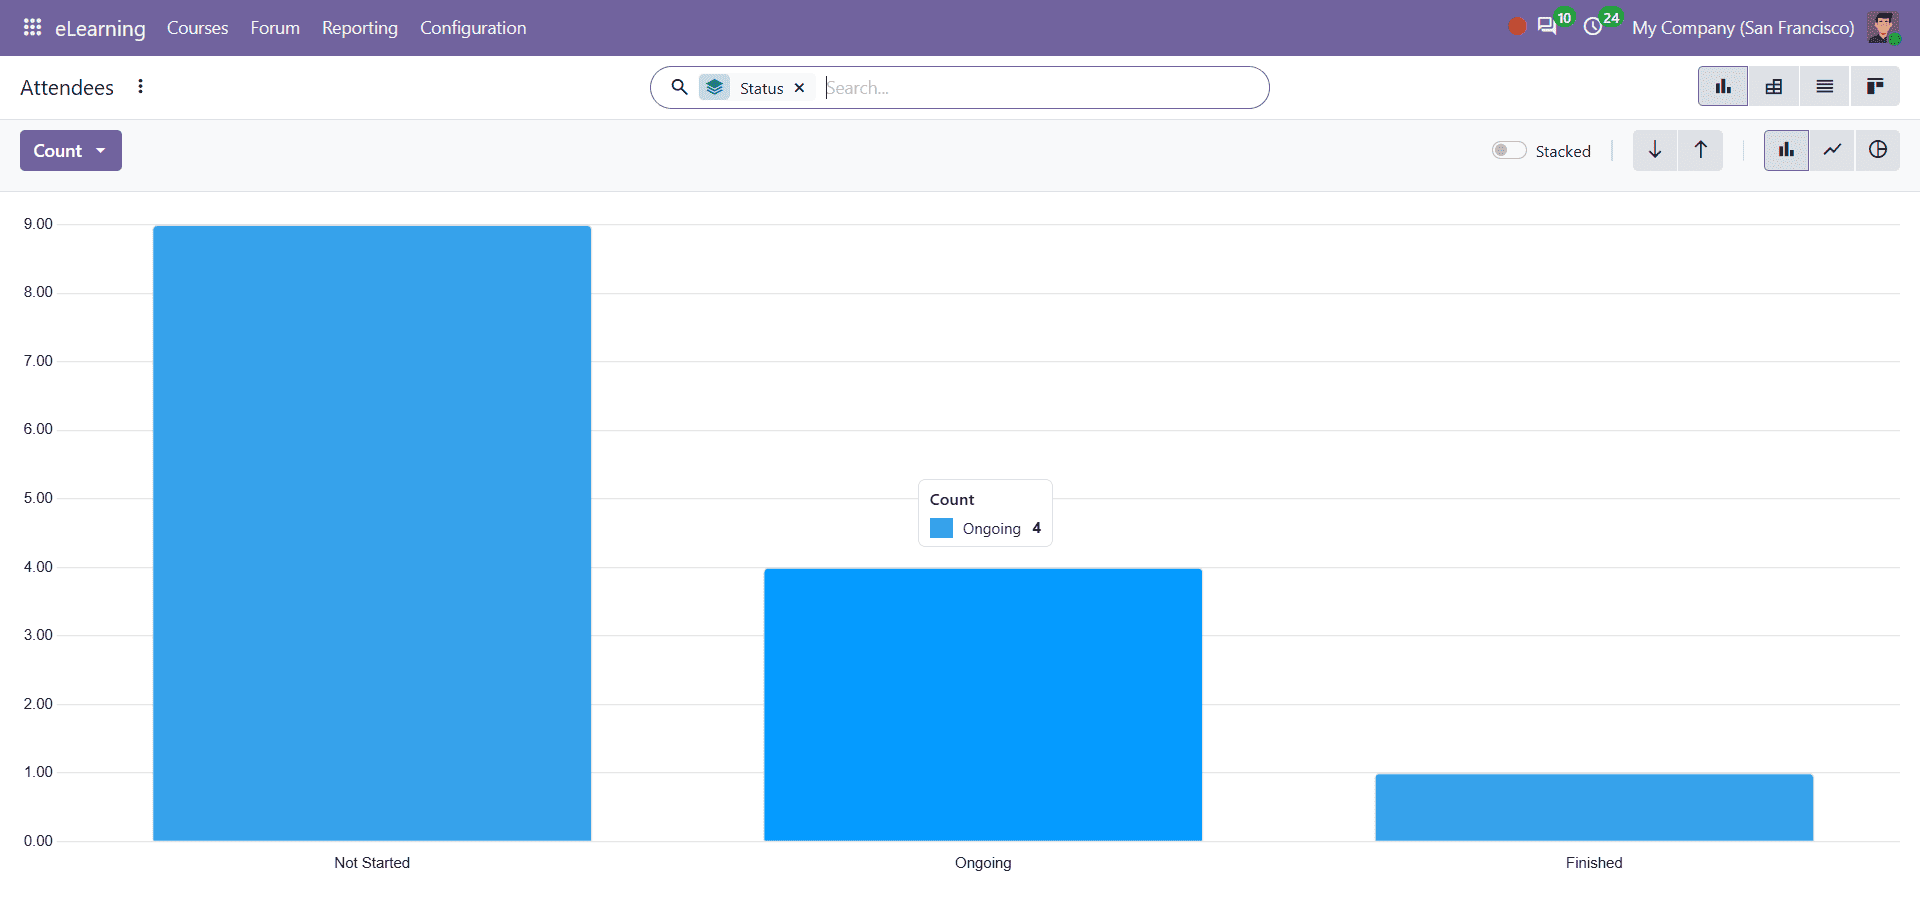
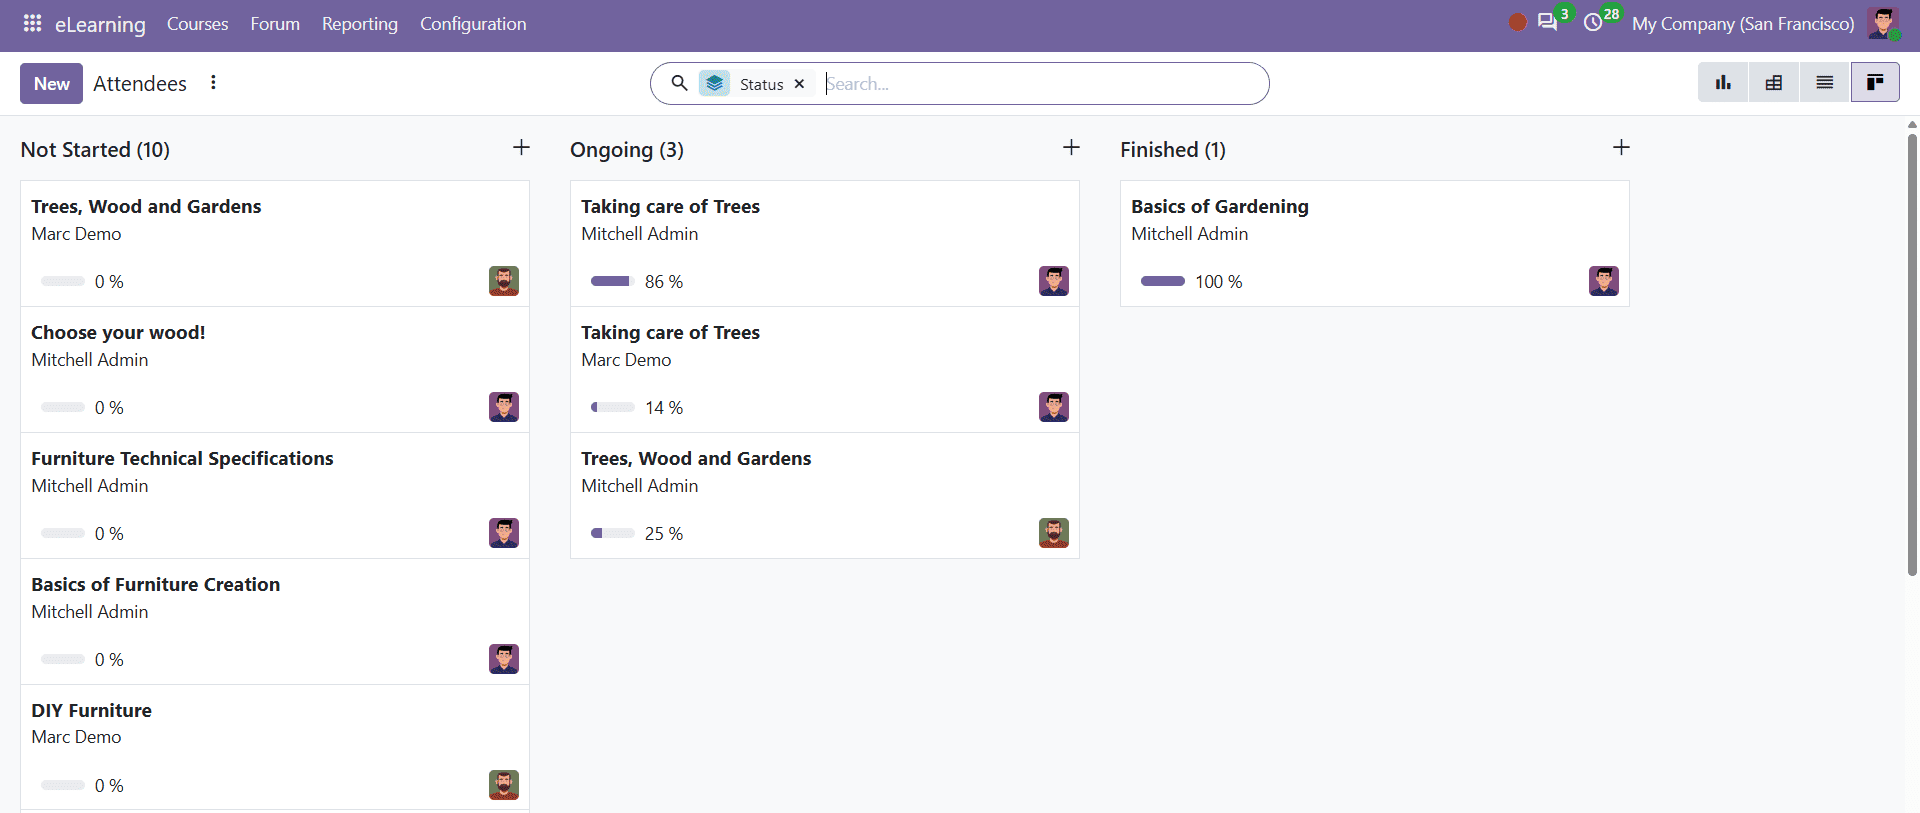
You can also change the report view to Pivot, List, or Kanban. To view different measures, click on the Count option.
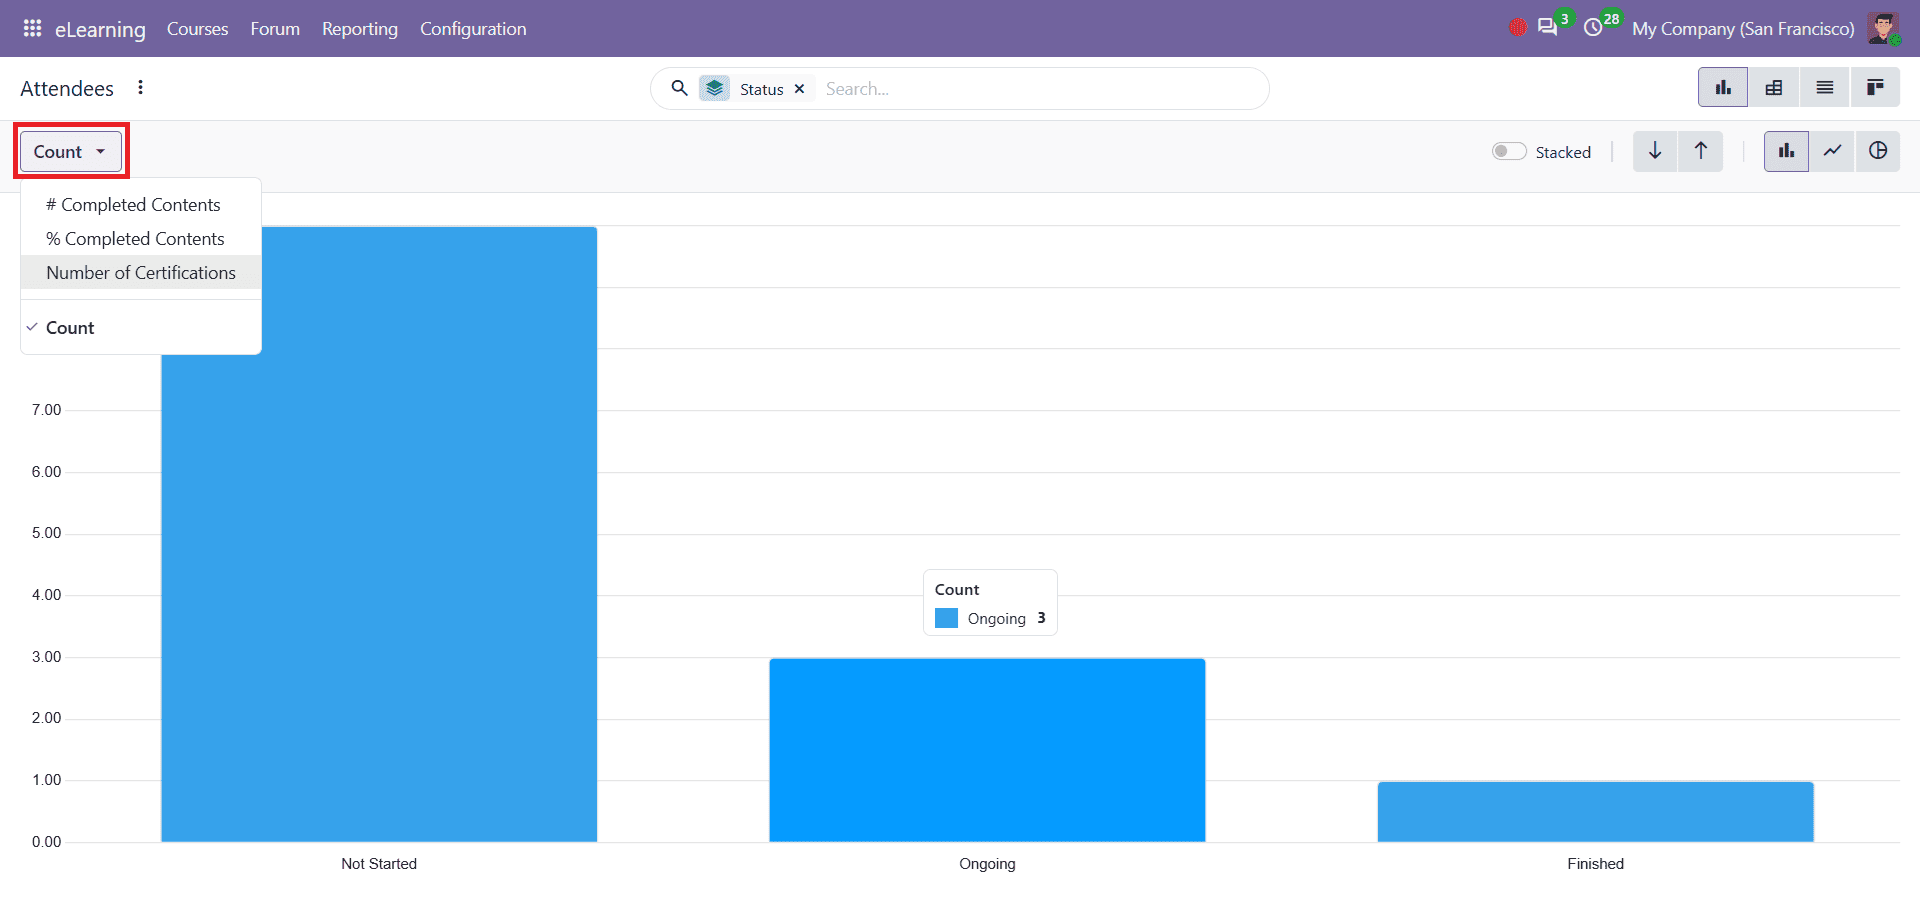
The available measures include # Completed Contents, % Completed Contents, Number of Certifications, and Count. The % Completed Contents is useful for checking the progress made by learners in a course. It shows the percentage of course content completed by attendees, as shown below.
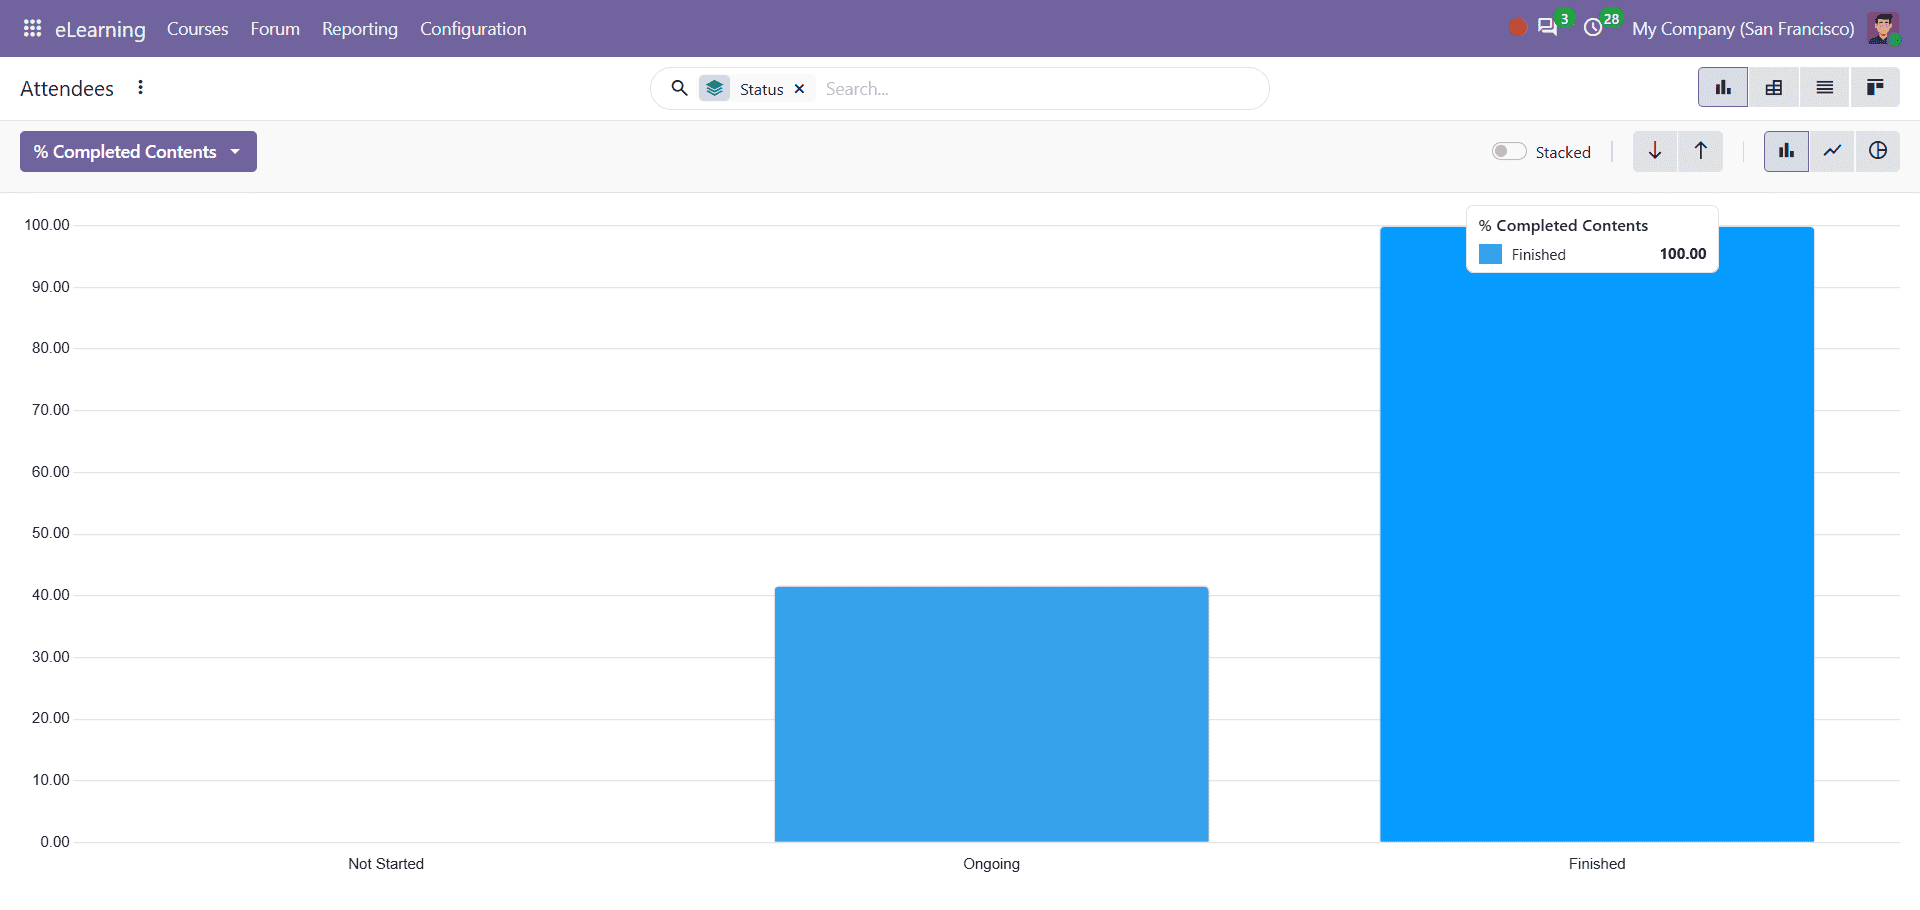
These measures help course managers analyse learner progress, monitor content completion, and understand course participation.
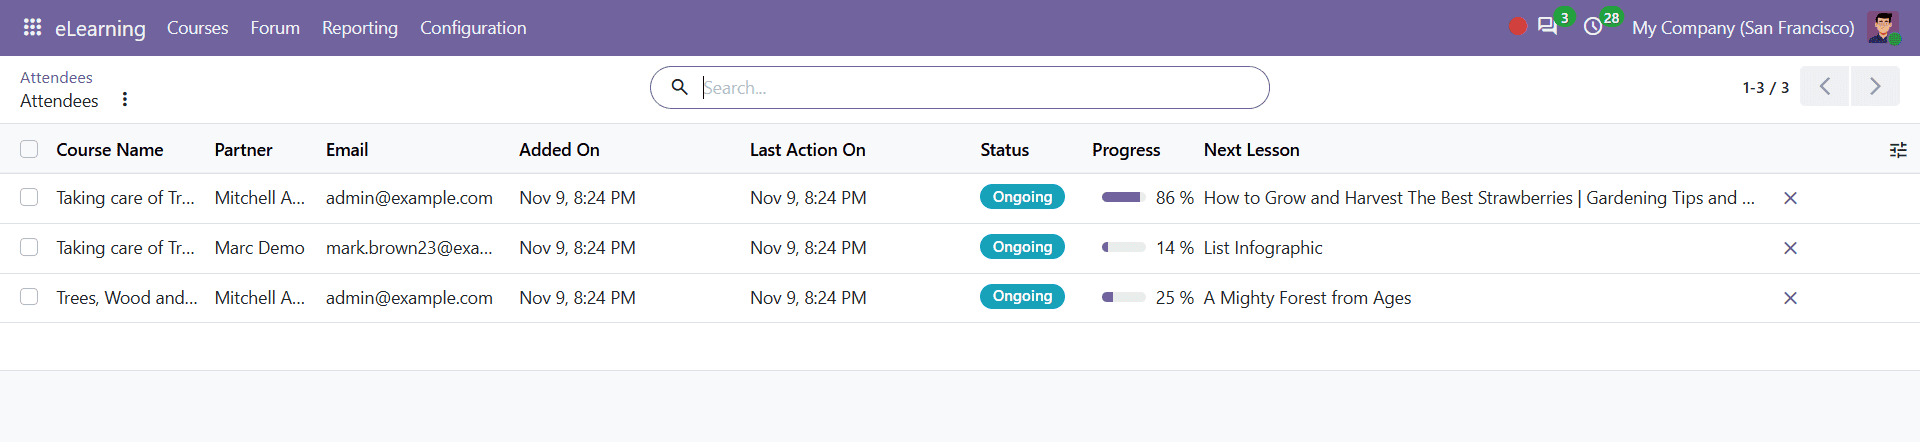
These options help users check how much course content attendees have completed and view other attendee-related information. If you click on a bar, you can view details of attendees in the progress category. Ongoing bar status is shown below.
The Kanban view of Attendees is shown below.
Reviews
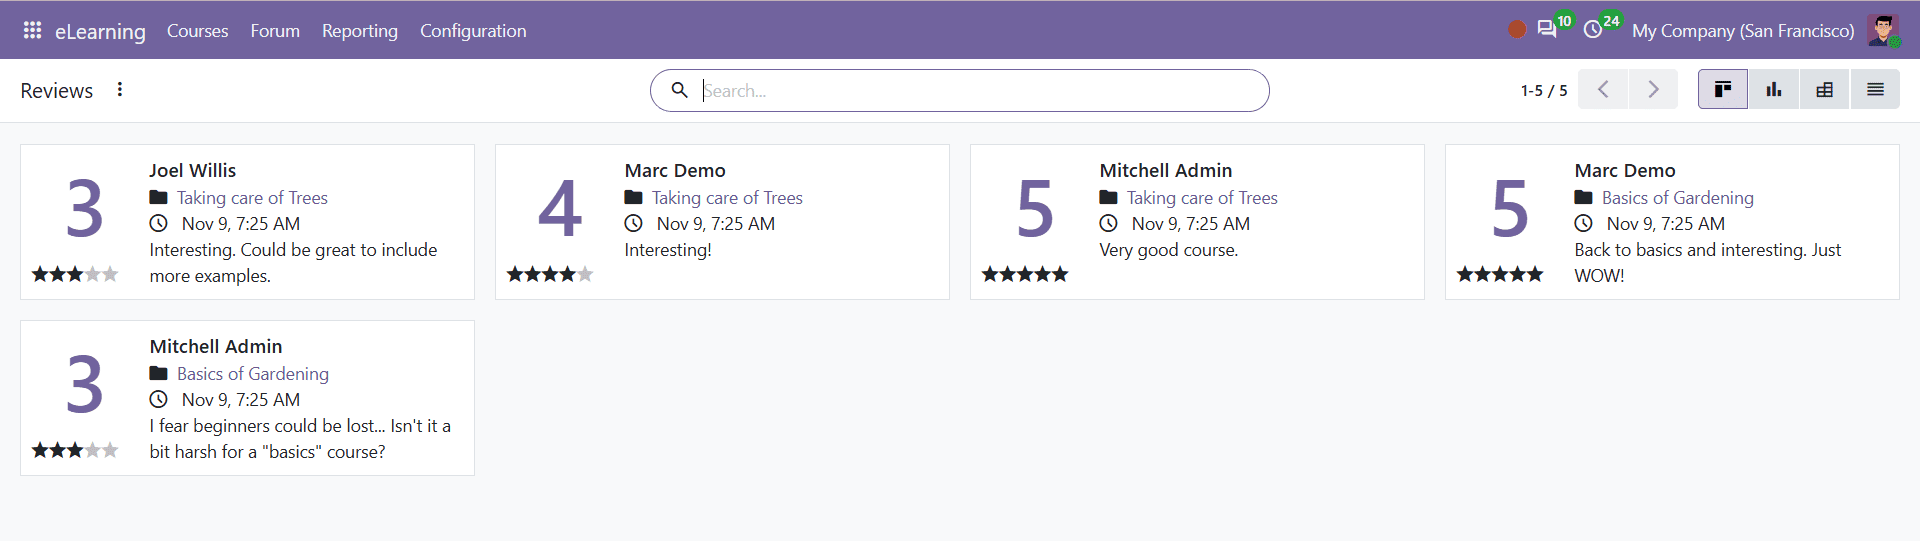
Select Reviews from the Reporting menu to view the feedback given by attendees. The report displays reviews in Kanban view. Each review card shows the reviewer's name, course name, rating, date, and written comments. The numerical rating and stars make it easier to understand how attendees rate their courses. Users can also read the comments to see what learners think about the course content.
Quizzes
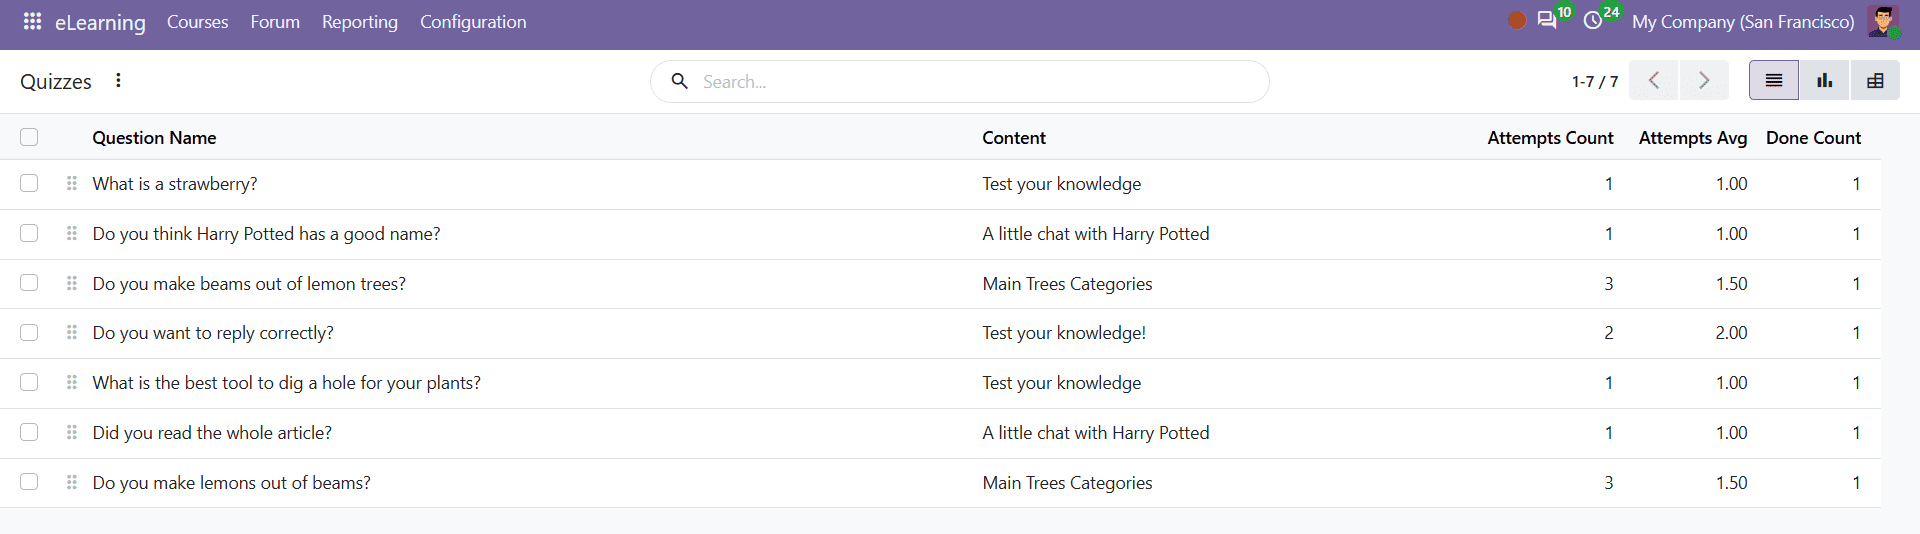
Select Quizzes from the Reporting menu. The report opens in the default List view, where you can see the quiz questions created for your course content. The List view also shows details about quiz attempts. It includes the question name, related course content, total attempts, average attempts, and the number of completed attempts. This helps users see how many times learners have attempted the quiz and how many attempts have been completed.
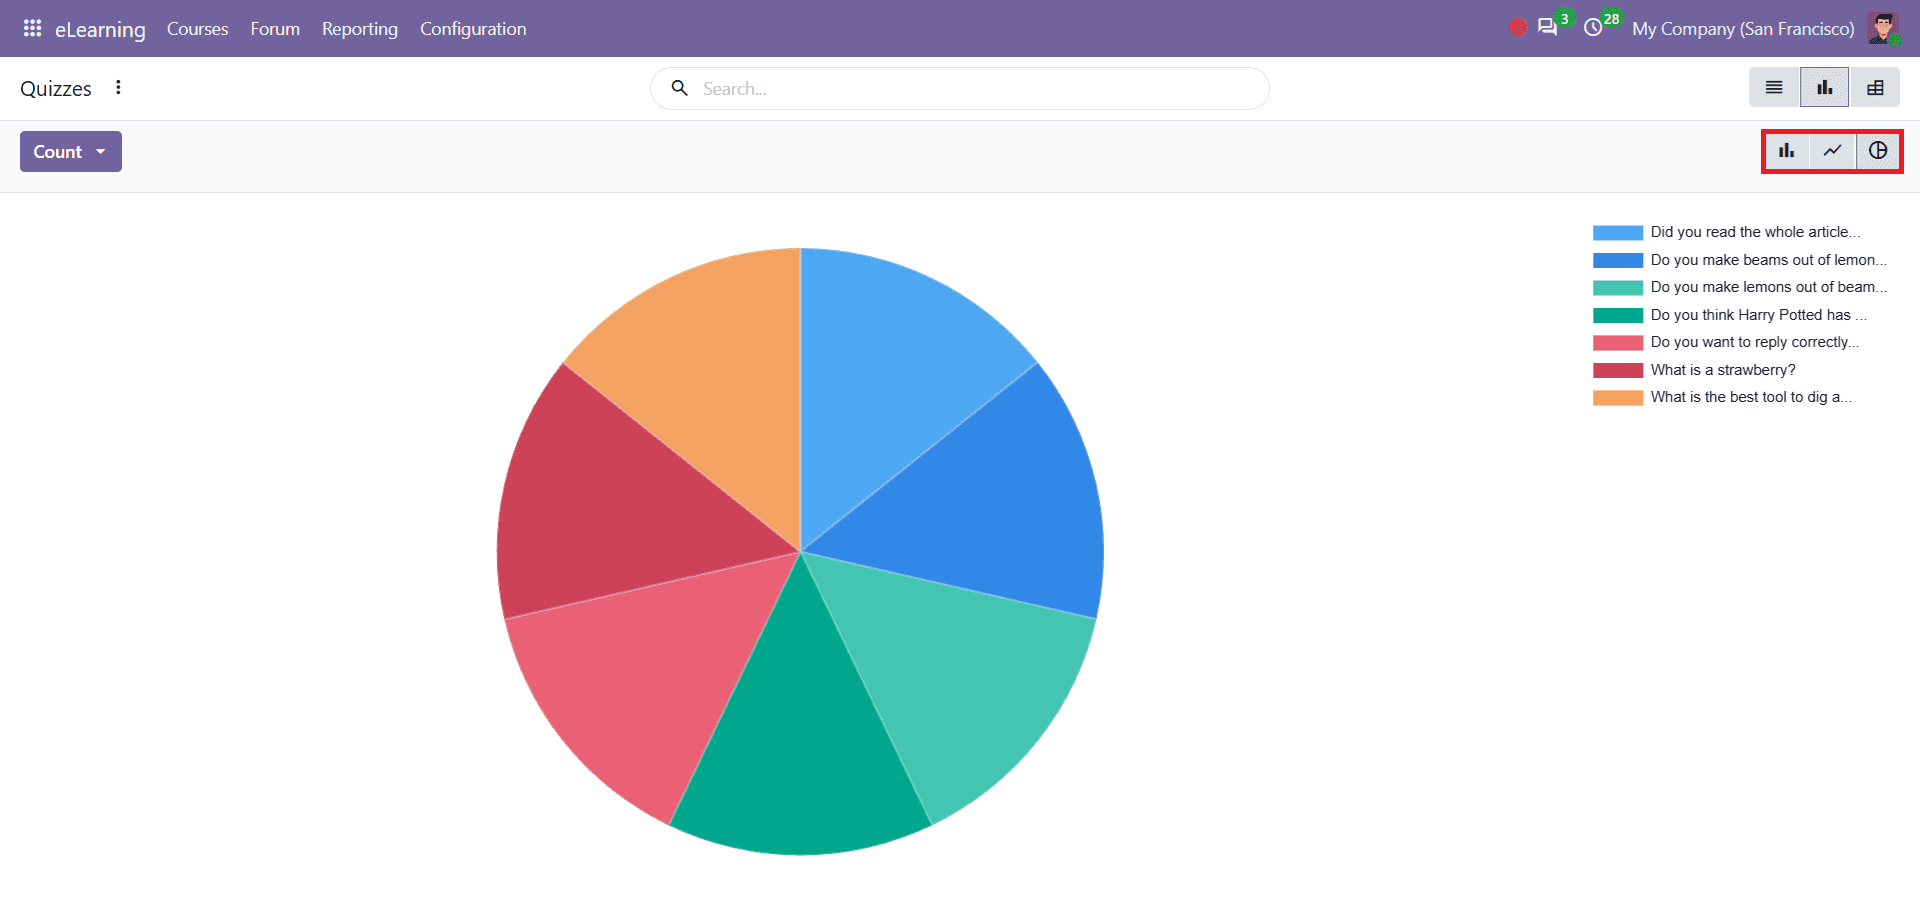
Odoo 20 also provides Graph and Pivot views to analyse quiz-related information. These views allow users to examine the quiz data in different formats.
In Graph view, you can change the view to three options: Bar chart, Line chart, and Pie chart. Pie chart view is shown below.
Exporting eLearning Report Data
Odoo 20 allows users to export report records for further use. To do this, select Courses from the Reporting menu and switch to List view. Click the three dots to find the Export option in List view, as shown below.
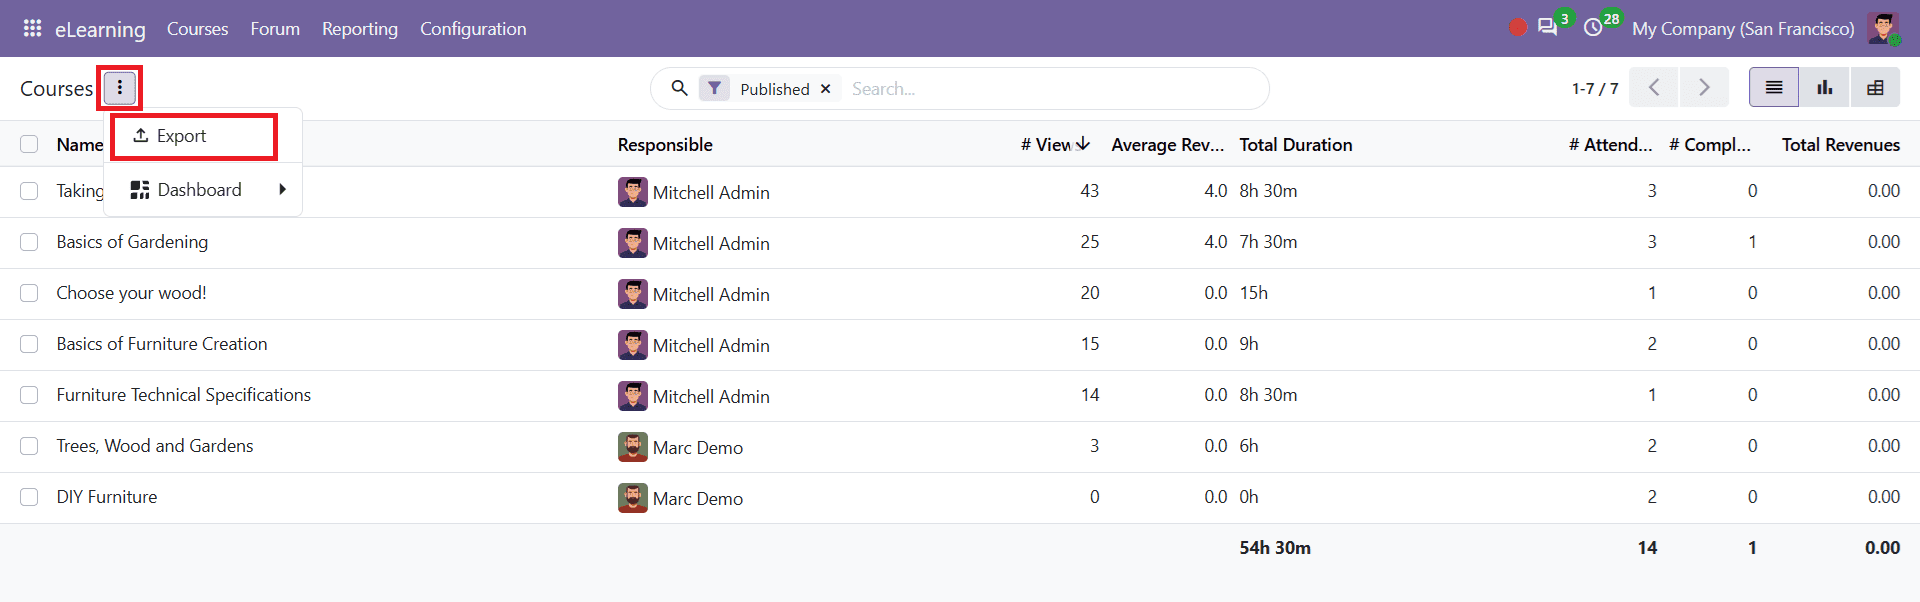
This allows users to export the required records for further analysis.
The Odoo 20 eLearning reporting features help businesses track course performance and understand attendee progress. The Reporting section provides details about course views, revenue, attendee progress, reviews, and quiz attempts. Course managers can also check how much content each attendee has completed and export report data when needed. These features make it easier to follow course activities and understand how the eLearning courses are performing.
To read more about How to Segment Contacts in Odoo 20 Using Tags, Industries, and Country Groups, refer to our blog, How to Segment Contacts in Odoo 20 Using Tags, Industries, and Country Groups.