Most companies that work with multiple companies within Odoo experience the same problem: there isn't a single screen where a manager can quickly check the sales performance of their companies. The process involves switching company context, then checking the dashboard of one company, repeating for the next company, and once you are done with the loop, the data you were looking at is outdated.
In this guide, we will go step-by-step through creating the actual solution for this task: the real-time multi-company sales KPI dashboard based on Odoo 19's OWL 2 components. At the end of the tutorial, you will be able to create an Odoo module with a client-action dashboard showing revenue, orders, and customer count per company that the current user has access to, with a period filter (today/week/month/quarter/year), a company selection dropdown, and clickable KPI cards leading to the corresponding Odoo screens.
Module Structure
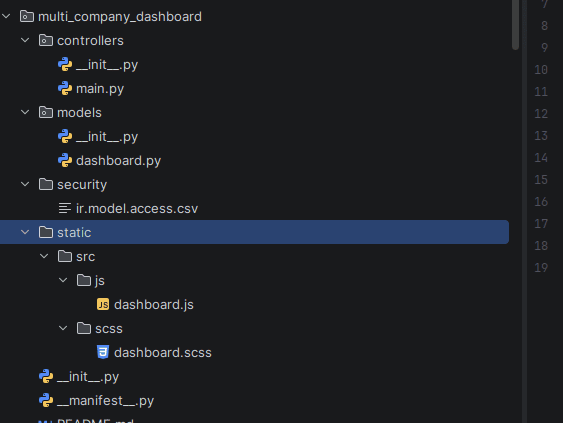
Manifest
{
    "name": "Multi-Company Sales Dashboard",
    "version": "19.0.1.0.0",
    "summary": "Aggregated sales KPIs across all your companies in one view",
    "description": """
        An OWL 2 client-action dashboard that queries sale.order data
        across every company the logged-in user belongs to, and displays
        aggregated KPI cards with a company filter and period selector.
    """,
    "category": "Sales",
    "author": "Cybrosys Techno Solutions",
    "website": "https://www.cybrosys.com",
    "license": "LGPL-3",
    "depends": ["sale"],
    "data": [
        "security/ir.model.access.csv",
        "views/dashboard_action.xml",
    ],
    "assets": {
        "web.assets_backend": [
            "multi_company_dashboard/static/src/scss/dashboard.scss",
            "multi_company_dashboard/static/src/js/dashboard.js",
            "multi_company_dashboard/static/src/xml/dashboard.xml",
        ],
    },
    "images": ["static/description/icon.png"],
    "application": True,
    "installable": True,
}
Access Rights
id,name,model_id:id,group_id:id,perm_read,perm_write,perm_create,perm_unlink
access_multi_company_dashboard,access_multi_company_dashboard,model_multi_company_dashboard,base.group_user,1,1,1,1
Menu and Action
dashboard_action.xml
<?xml version="1.0" encoding="UTF-8" ?>
<odoo>
    <record id="action_multi_company_dashboard" model="ir.actions.client">
        <field name="name">Multi-Company Dashboard</field>

        <field name="tag">multi_company_dashboard</field>
        <field name="target">main</field>
    </record>
    <menuitem id="menu_multi_company_dashboard_root"
              name="MC Dashboard"
              action="action_multi_company_dashboard"
              web_icon="multi_company_dashboard,static/description/icon.png"
              sequence="5"/>
</odoo>
Backend Model
Server-side core logic: The method get_dashboard_data() is an RPC method invoked from JavaScript; it iterates through all companies to which the current user has access and invokes the _compute_company_kpis() method for each of them. This method accesses sale.order via with_company() + sudo() to calculate the total revenue, orders, and number of customers by company without consideration of the company which is currently set active by the user and also calculates the percentage change compared to the previous period. Other helper methods are _pct_change, _get_date_range, _get_prev_range, and _color_for.
dashboard.py
# -*- coding: utf-8 -*-
from odoo import models, fields, api
from datetime import datetime, timedelta
from dateutil.relativedelta import relativedelta
import pytz

class MultiCompanyDashboard(models.TransientModel):
    _name = 'multi.company.dashboard'
    _description = 'Multi-Company Sales Dashboard'
    @api.model
    def get_dashboard_data(self, period='month'):
        """Main RPC entry point. Called from JS like:
            await this.orm.call(
                "multi.company.dashboard",
                "get_dashboard_data",
                ["month"],
            );
        Args:
            period: One of 'today', 'week', 'month', 'quarter', 'year'.
        Returns a dict with:
            - period (str)
            - date_from, date_to (str): ISO date strings
            - companies (list[dict]): per-company KPI data
            - totals (dict): aggregated totals across all companies
        """
        today = fields.Date.today()

        companies_data = []
        for company in self.env.user.company_ids:
            data = self._compute_company_kpis(
                company, date_from, date_to, prev_from, prev_to
            )
            companies_data.append(data)

        total_revenue = sum(c['revenue'] for c in companies_data)
        total_orders = sum(c['orders'] for c in companies_data)
        total_customers = sum(c['customers'] for c in companies_data)
        return {
            'period': period,
            'date_from': str(date_from),
            'date_to': str(date_to),
            'companies': companies_data,
            'totals': {
                'revenue': total_revenue,
                'orders': total_orders,
                'customers': total_customers,
            },
        }

    def _compute_company_kpis(self, company, date_from, date_to,
                               prev_from, prev_to):
        """Query sale.order for one company and return its KPIs.
        Key multi-company pattern:
            self.env['sale.order'].with_company(company).sudo()
        - with_company(company): sets the company context so Odoo's
          record rules apply to the correct company, not the active one.
        - sudo(): bypasses per-record access rules so we can aggregate
          totals regardless of the user's individual order permissions.
        """
        SaleOrder = self.env['sale.order'].with_company(company).sudo()

        tz_name = self.env.context.get('tz') or self.env.user.tz or 'UTC'
        user_tz = pytz.timezone(tz_name)
        dt_from = user_tz.localize(
            datetime.combine(date_from, datetime.min.time())
        ).astimezone(pytz.utc).replace(tzinfo=None)
        dt_to = user_tz.localize(
            datetime.combine(date_to, datetime.max.time())
        ).astimezone(pytz.utc).replace(tzinfo=None)

        current_orders = SaleOrder.search([
            ('company_id', '=', company.id),
            ('state', 'in', ['sale']),
            ('date_order', '>=', dt_from),
            ('date_order', '<=', dt_to),
        ])

        prev_dt_from = user_tz.localize(
            datetime.combine(prev_from, datetime.min.time())
        ).astimezone(pytz.utc).replace(tzinfo=None)
        prev_dt_to = user_tz.localize(
            datetime.combine(prev_to, datetime.max.time())
        ).astimezone(pytz.utc).replace(tzinfo=None)
        previous_orders = SaleOrder.search([
            ('company_id', '=', company.id),
            ('state', 'in', ['sale', 'done']),
            ('date_order', '>=', prev_dt_from),
            ('date_order', '<=', prev_dt_to),
        ])

        cur_revenue = sum(current_orders.mapped('amount_total'))
        cur_orders = len(current_orders)
        cur_customers = len(set(current_orders.mapped('partner_id').ids))
        avg_order = cur_revenue / cur_orders if cur_orders else 0.0

        prev_revenue = sum(previous_orders.mapped('amount_total'))
        prev_orders_count = len(previous_orders)
        prev_customers = len(set(previous_orders.mapped('partner_id').ids))
        return {
            'id': company.id,
            'name': company.name,
            'currency': company.currency_id.symbol or '$',
            'color': self._color_for(company.id),
            'revenue': cur_revenue,
            'orders': cur_orders,
            'customers': cur_customers,
            'avg_order': avg_order,
            'revenue_change': self._pct_change(prev_revenue, cur_revenue),
            'orders_change': self._pct_change(prev_orders_count, cur_orders),
            'customers_change': self._pct_change(prev_customers, cur_customers),
        }
    @staticmethod
    def _pct_change(old_value, new_value):
        """Calculate percentage change between two values.
        Returns 0 if both are zero, 100 if old is zero but new isn't.
        """
        if not old_value:
            return 100.0 if new_value else 0.0
        return round(((new_value - old_value) / old_value) * 100, 1)
    @staticmethod
    def _get_date_range(today, period):
        """Return (date_from, date_to) for the requested period.
        Examples for today = 2025-04-25:
          'today'   ? (2025-04-25, 2025-04-25)
          'week'    ? (2025-04-21, 2025-04-25)  Monday to today
          'month'   ? (2025-04-01, 2025-04-25)
          'quarter' ? (2025-04-01, 2025-04-25)  Q2 starts in April
          'year'    ? (2025-01-01, 2025-04-25)
        """
        if period == 'today':
            return today, today
        if period == 'week':
            return today - timedelta(days=today.weekday()), today
        if period == 'month':
            return today.replace(day=1), today
        if period == 'quarter':
            quarter_start_month = ((today.month - 1) // 3) * 3 + 1
            return today.replace(month=quarter_start_month, day=1), today
        if period == 'year':
            return today.replace(month=1, day=1), today
        return today.replace(day=1), today  # default to month
    @staticmethod
    def _get_prev_range(date_from, date_to, period):
        """Shift the date range backward by one period for comparison.
        Uses relativedelta for months/quarters/years so that February
        and variable month lengths are handled correctly.
        """
        if period == 'quarter':
            return (date_from - relativedelta(months=3),
                    date_to - relativedelta(months=3))
        if period == 'year':
            return (date_from - relativedelta(years=1),
                    date_to - relativedelta(years=1))
        if period == 'month':
            return (date_from - relativedelta(months=1),
                    date_to - relativedelta(months=1))
        # today / week: shift by the exact number of days in the range
        delta = date_to - date_from + timedelta(days=1)
        return date_from - delta, date_to - delta
    @staticmethod
    def _color_for(company_id):
        """Assign a consistent accent color based on company ID.
        Using modulo ensures the same company always gets the same color
        across page reloads.
        """
        palette = [
            '#6366f1',  # indigo
            '#0ea5e9',  # sky
            '#10b981',  # emerald
            '#f59e0b',  # amber
            '#ef4444',  # red
            '#8b5cf6',  # violet
            '#ec4899',  # pink
            '#14b8a6',  # teal
        ]
        return palette[company_id % len(palette)]
Owl Component
The Frontend Controller: In the setup() function, it integrates the Odoo services (orm – for RPC calls, action – for opening windows, and notification – for error handling) and reactive state. The loadData() method invokes the backend service and keeps its return value. Other methods handle user interaction: changing the period tabs, opening and closing the company selection window, filtering KPIs by chosen company, currency formatting, and opening sales orders and customers views.
dashboard.js
/** @odoo-module **/
import { Component, useState, onWillStart } from "@odoo/owl";
import { useService } from "@web/core/utils/hooks";
import { registry } from "@web/core/registry";
class MultiCompanyDashboard extends Component {

    static template = "multi_company_dashboard.Dashboard";
    setup() {
        // --- Odoo Services ---
        // useService() must be called inside setup(), not in methods.
        this.orm = useService("orm");               // For RPC calls to Python
        this.action = useService("action");                  this.notification = useService("notification");

        this.state = useState({
            loading: true,
            error: null,
            period: "month",
            data: null,
            selectedCompanyId: null,
            dropdownOpen: false,
        });

        onWillStart(() => this.loadData());
    }
    async loadData() {
        this.state.loading = true;
        this.state.error = null;
        try {

            this.state.data = await this.orm.call(
                "multi.company.dashboard",
                "get_dashboard_data",
                [this.state.period],
            );
        } catch (err) {


            var msg = (err.message && err.message.data && err.message.data.message)
                || err.message
                || "Failed to load data.";
            this.state.error = msg;
            this.notification.add(msg, { type: "danger" });
        } finally {
            this.state.loading = false;
        }
    }
    setPeriod(p) {
        if (this.state.period === p) return;
        this.state.period = p;
        this.loadData();
    }

    toggleDropdown() {
        this.state.dropdownOpen = !this.state.dropdownOpen;
    }
    selectCompany(id) {

        this.state.selectedCompanyId = id;
        this.state.dropdownOpen = false;
    }

    selectedName() {
        if (!this.state.data || this.state.selectedCompanyId === null) {
            return "All Companies";
        }
        var company = this.state.data.companies.find(
            (co) => co.id === this.state.selectedCompanyId
        );
        return company ? company.name : "All Companies";
    }

    filtered() {
        if (!this.state.data) return [];
        if (this.state.selectedCompanyId === null) {
            return this.state.data.companies; // All
        }
        return this.state.data.companies.filter(
            (c) => c.id === this.state.selectedCompanyId
        );
    }

    totals() {
        var list = this.filtered();
        return {
            revenue: list.reduce((sum, c) => sum + c.revenue, 0),
            orders: list.reduce((sum, c) => sum + c.orders, 0),
            customers: list.reduce((sum, c) => sum + c.customers, 0),
        };
    }

    openOrders(companyId) {

        var domain = [];
        var context = {};
        if (companyId) {
            domain = [["company_id", "=", companyId]];
            context = { allowed_company_ids: [companyId] };
        } else if (this.state.data && this.state.data.companies) {
            domain = [["company_id", "in", this.state.data.companies.map(c => c.id)]];
        }
        this.action.doAction({
            type: "ir.actions.act_window",
            name: "Sales Orders",
            res_model: "sale.order",
            view_mode: "list,form",
            views: [[false, "list"], [false, "form"]],
            domain: domain,
            context: context,
        });
    }
    openCustomers(companyId) {

        var domain = [];
        var context = {};
        if (companyId) {
            domain = [["company_id", "in", [companyId, false]]];
            context = { allowed_company_ids: [companyId] };
        } else if (this.state.data && this.state.data.companies) {
            domain = [["company_id", "in", this.state.data.companies.map(c => c.id).concat(false)]];
        }
        this.action.doAction({
            type: "ir.actions.act_window",
            name: "Customers",
            res_model: "res.partner",
            view_mode: "kanban,list,form",
            views: [[false, "kanban"], [false, "list"], [false, "form"]],
            domain: domain,
            context: context,
        });
    }

    openOrdersIfAny() {
        if (this.totals().orders > 0) {
            this.openOrders(this.state.selectedCompanyId);
        }
    }
    openCustomersIfAny() {
        if (this.totals().customers > 0) {
            this.openCustomers(this.state.selectedCompanyId);
        }
    }

    hasOrders() { return this.totals().orders > 0; }

    hasCustomers() { return this.totals().customers > 0; }

    fmtFull(amount, sym) {
        sym = sym || "$";
        if (amount == null) return "--";
        return sym + Number(amount).toFixed(0).replace(/\B(?=(\d{3})+(?!\d))/g, ",");
    }

    dateRange() {
        if (!this.state.data) return "";
        var d = this.state.data;
        var f = (s) => new Date(s).toLocaleDateString("en-US", {
            month: "short", day: "numeric", year: "numeric",
        });
        return d.period === "today"
            ? f(d.date_from)
            : f(d.date_from) + " - " + f(d.date_to);
    }

    currentCurrency() {
        if (!this.state.data) return "$";
        if (this.state.selectedCompanyId !== null) {
            var co = this.state.data.companies.find(
                (c) => c.id === this.state.selectedCompanyId
            );
            return co ? co.currency : "$";
        }

        return this.state.data.companies.length ? this.state.data.companies[0].currency : "$";
    }
}

registry.category("actions").add("multi_company_dashboard", MultiCompanyDashboard);
Qweb Template
HTML/XML markup for the dashboard generated by the OWL component. This includes the definition of the header section (title, date range picker, company selection dropdown, period tab navigation, and refresh button), loading and error status, and the KPI cards grid (sales, order count, customers, and companies).
dashboard.xml
<?xml version="1.0" encoding="UTF-8"?>
<templates xml:space="preserve">
<t t-name="multi_company_dashboard.Dashboard">
  <div class="mcd-root">

    <div class="mcd-header">
      <div class="mcd-header-left">
        <h1 class="mcd-title">Sales Dashboard</h1>
        <span class="mcd-subtitle" t-if="state.data" t-esc="dateRange()"/>
      </div>
      <div class="mcd-header-right">

        <t t-if="state.data">
          <div class="mcd-dd-wrap">
            <button class="mcd-dd-btn" t-on-click="toggleDropdown">
              <t t-esc="selectedName()"/>
              <svg width="12" height="12" viewBox="0 0 24 24" fill="none"
                   stroke="currentColor" stroke-width="3">
                <polyline points="6 9 12 15 18 9"/>
              </svg>
            </button>
            <div t-att-class="'mcd-dd-menu' + (state.dropdownOpen ? ' open' : '')">
              <button t-att-class="'mcd-dd-item' + (state.selectedCompanyId === null ? ' active' : '')"
                      t-on-click="() => this.selectCompany(null)">
                All Companies
              </button>
              <t t-foreach="state.data.companies" t-as="co" t-key="co.id">
                <button t-att-class="'mcd-dd-item' + (state.selectedCompanyId === co.id ? ' active' : '')"
                        t-on-click="() => this.selectCompany(co.id)">
                  <span class="mcd-dot" t-att-style="'background:' + co.color"/>
                  <t t-esc="co.name"/>
                </button>
              </t>
            </div>
          </div>
        </t>

        <div class="mcd-tabs">
          <button t-att-class="'mcd-tab' + (state.period === 'today' ? ' active' : '')"
                  t-on-click="() => this.setPeriod('today')">Today</button>
          <button t-att-class="'mcd-tab' + (state.period === 'week' ? ' active' : '')"
                  t-on-click="() => this.setPeriod('week')">Week</button>
          <button t-att-class="'mcd-tab' + (state.period === 'month' ? ' active' : '')"
                  t-on-click="() => this.setPeriod('month')">Month</button>
          <button t-att-class="'mcd-tab' + (state.period === 'quarter' ? ' active' : '')"
                  t-on-click="() => this.setPeriod('quarter')">Quarter</button>
          <button t-att-class="'mcd-tab' + (state.period === 'year' ? ' active' : '')"
                  t-on-click="() => this.setPeriod('year')">Year</button>
        </div>

        <button t-att-class="'mcd-refresh' + (state.loading ? ' spin' : '')"
                t-on-click="loadData" title="Refresh">?</button>
      </div>
    </div>

    <t t-if="!state.data">
      <t t-if="state.loading">
        <div class="mcd-loading">
          <div class="mcd-spinner"/>
          <p>Loading...</p>
        </div>
      </t>
    </t>

    <t t-if="state.error">
      <div class="mcd-error">
        <p t-esc="state.error"/>
        <button class="mcd-retry" t-on-click="loadData">Retry</button>
      </div>
    </t>
      <t t-if="state.data">
      <div class="mcd-kpis">
        <div t-att-class="'mcd-kpi' + (hasOrders() ? ' clickable' : '')"
             t-on-click="openOrdersIfAny">
          <span class="mcd-kpi-lbl">Total Revenue</span>
          <span class="mcd-kpi-val" t-esc="fmtFull(totals().revenue, currentCurrency())"/>
        </div>
        <div t-att-class="'mcd-kpi' + (hasOrders() ? ' clickable' : '')"
             t-on-click="openOrdersIfAny">
          <span class="mcd-kpi-lbl">Total Orders</span>
          <span class="mcd-kpi-val" t-esc="totals().orders"/>
        </div>
        <div t-att-class="'mcd-kpi' + (hasCustomers() ? ' clickable' : '')"
             t-on-click="openCustomersIfAny">
          <span class="mcd-kpi-lbl">Customers</span>
          <span class="mcd-kpi-val" t-esc="totals().customers"/>
        </div>
        <div class="mcd-kpi">
          <span class="mcd-kpi-lbl">Companies</span>
          <span class="mcd-kpi-val" t-esc="filtered().length"/>
        </div>
      </div>
    </t>
  </div>
</t>
</templates>
Styles
dashboard.scss
$bg:        #f7f8fa;
$white:     #ffffff;
$border:    #e5e7eb;
$text:      #1f2937;
$text-sec:  #6b7280;
$text-dim:  #9ca3af;
$accent:    #4f46e5;
$accent-bg: #eef2ff;
$radius:    10px;
$tr:        0.2s ease;
.mcd-root {
  min-height: 100vh;
  background: $bg !important;
  padding: 24px 32px 40px;
  color: $text !important;
  font-family: -apple-system, BlinkMacSystemFont, 'Segoe UI', sans-serif;
  *, *::before, *::after { box-sizing: border-box; }
  h1, h2, h3, p, span, button { color: inherit; }
}
/* -- Header -- */
.mcd-header {
  display: flex; align-items: center; justify-content: space-between;
  flex-wrap: wrap; gap: 12px; margin-bottom: 28px;
}
.mcd-header-left { display: flex; align-items: baseline; gap: 12px; }
.mcd-header-right { display: flex; align-items: center; gap: 8px; }
.mcd-title   { font-size: 20px; font-weight: 700; margin: 0; color: $text !important; }
.mcd-subtitle { font-size: 13px; color: $text-sec; }
/* -- Company Dropdown -- */
.mcd-dd-wrap { position: relative; }
.mcd-dd-btn {
  display: flex; align-items: center; gap: 6px;
  padding: 6px 12px; background: $white; border: 1px solid $border;
  border-radius: 7px; font-size: 13px; font-weight: 500;
  color: $text; cursor: pointer;
  &:hover { border-color: darken($border, 10%); }
}
.mcd-dd-menu {
  position: absolute; top: calc(100% + 4px); left: 0; min-width: 190px;
  background: $white; border: 1px solid $border; border-radius: 8px;
  box-shadow: 0 4px 12px rgba(0,0,0,.08); padding: 4px; z-index: 100;
  opacity: 0; transform: translateY(-4px); pointer-events: none;
  transition: opacity .12s, transform .12s;
  &.open { opacity: 1; transform: translateY(0); pointer-events: auto; }
}
.mcd-dd-item {
  display: flex; align-items: center; gap: 7px; width: 100%;
  padding: 7px 10px; border: none; background: none; font-size: 13px;
  color: $text; cursor: pointer; border-radius: 5px; text-align: left;
  &:hover { background: $bg; }
  &.active { background: $accent-bg; color: $accent; font-weight: 600; }
}
.mcd-dot { width: 8px; height: 8px; border-radius: 50%; flex-shrink: 0; }
/* -- Period Tabs -- */
.mcd-tabs {
  display: flex; background: $white; border: 1px solid $border;
  border-radius: 7px; padding: 2px; gap: 1px;
}
.mcd-tab {
  border: none; background: none; color: $text-sec; font-size: 12px;
  font-weight: 500; padding: 5px 11px; border-radius: 5px; cursor: pointer;
  transition: all $tr;
  &:hover { color: $text; background: $bg; }
  &.active { color: $accent; background: $accent-bg; font-weight: 600; }
}
/* -- Refresh Button -- */
.mcd-refresh {
  width: 32px; height: 32px; display: grid; place-items: center;
  background: $white; border: 1px solid $border; border-radius: 7px;
  font-size: 16px; color: $text-sec; cursor: pointer;
  &:hover { color: $text; }
  &.spin { animation: mcd-spin .6s linear infinite; }
}
@keyframes mcd-spin { to { transform: rotate(360deg); } }
/* -- Loading / Error States -- */
.mcd-loading {
  display: flex; flex-direction: column; align-items: center;
  padding: 80px 0; gap: 12px; color: $text-sec; font-size: 14px;
}
.mcd-spinner {
  width: 28px; height: 28px; border: 3px solid $border;
  border-top-color: $accent; border-radius: 50%;
  animation: mcd-spin .6s linear infinite;
}
.mcd-error {
  text-align: center; padding: 60px 20px;
  p { color: $text-sec; font-size: 14px; margin: 0 0 12px; }
}
.mcd-retry {
  padding: 7px 18px; background: $accent; color: #fff; border: none;
  border-radius: 6px; font-weight: 600; font-size: 13px; cursor: pointer;
}
/* -- KPI Cards -- */
.mcd-kpis {
  display: grid;
  grid-template-columns: repeat(auto-fit, minmax(200px, 1fr));
  gap: 16px;
}
.mcd-kpi {
  background: $white; border: 1px solid $border; border-radius: $radius;
  padding: 20px 24px; display: flex; flex-direction: column; gap: 4px;

  &.clickable {
    cursor: pointer;
    transition: transform $tr, border-color $tr, box-shadow $tr;
    &:hover {
      border-color: $accent;
      box-shadow: 0 4px 12px rgba(79, 70, 229, 0.08);
      transform: translateY(-2px);
    }
  }
}
.mcd-kpi-lbl {
  font-size: 12px; text-transform: uppercase; letter-spacing: .5px;
  color: $text-dim; font-weight: 500;
}
.mcd-kpi-val { font-size: 28px; font-weight: 700; }
/* -- Responsive -- */
@media (max-width: 640px) {
  .mcd-root { padding: 16px; }
  .mcd-kpis { grid-template-columns: 1fr 1fr; }
  .mcd-header { flex-direction: column; align-items: flex-start; }
  .mcd-kpi-val { font-size: 22px; }
}
Optional HTTP Endpoint
The ORM call() function is used to fetch all the data in OWL, and it doesn’t require the controller at all. The use of the controller is optional, and it can be used by some other external tool that needs to fetch the data of the dashboard.
# -*- coding: utf-8 -*-
from odoo import http
from odoo.http import request

class MultiCompanyDashboardController(http.Controller):
    @http.route('/multi_company_dashboard/data', type='jsonrpc',
                auth='user', methods=['POST'])
    def get_data(self, period='month'):
        """JSON endpoint that proxies to the transient model method.
        Endpoint:  POST /multi_company_dashboard/data
        Auth:      Active user session required
        Body:      {"params": {"period": "month"}}
        Response:  Same dict as get_dashboard_data()
        """
        return request.env['multi.company.dashboard'].get_dashboard_data(period)
The presentation and state management of the OWL 2 component, the user interactions such as period switching and company filtering, and the ability to direct the users with a single click to the relevant sales or customer records are still the focus. The heavy lifting is done in the Python layer. It goes through company_ids, pulls accurate KPIs using with_company() and sudo() regardless of the company currently active, and calculates period-over-period comparisons.
The result is one screen that eliminates the painstaking process of switching company context and checking dashboards one by one. Managers have real-time revenue, order, and customer numbers across all companies they have access to, with the ability to drill down into a company or see them all aggregated.
This same pattern - a transient model exposing an RPC method, coupled with an OWL client action - can be extended far beyond sales KPIs. Once that’s done, it’s a logical step to add daily revenue trends with Chart.js, expose the data via the optional HTTP controller to make it available to external tools like Power BI, or add other filters (by team, by product category, etc.).
To read more about Odoo 18 Multi-Company Setup: Guidelines and Tips, refer to our blog Odoo 18 Multi-Company Setup: Guidelines and Tips.